Turning Chatbot Replies into Interactive Artifacts
AI agents are getting ridiculously powerful. But most of us still experience them as... chatbots. Text in, text out. Maybe an image if we’re lucky. This is fine for summaries, but falls apart when we need actual analysis, interactive visuals, or domain-specific tools. To solve this, we started building a collection of interactive elements that LLMs can speak into existence, and a client can auto-detect and render. Instead of a wall of text, the same answer becomes a chart, a knowledge graph, a KPI, or anything else we can imagine.
Why chat alone isn’t enough
Use an LLM-heavy product for more than a few minutes and you’ll notice a pattern:
- The model gives a great answer.
- You immediately copy‑paste it somewhere else.
Sheets for analysis, graph tools for relationships, slides for presentations. The real work happens outside the conversation. The chat window is just a text generator. We wanted the chat itself to become the workspace. That meant the model had to return more than paragraphs. It needed to return artifacts: things the UI could render, query, and reuse. Our apprach consists of two pieces:
-
A vocabulary of artifacts Types like
bar_chart,knowledge_graph,kpi,sankey_diagram, etc. Each one has:- a representative codefence
- a renderer component (React, web component, etc).
-
A way for the model to emit them We use semantic code fences inside normal chat messages, e.g.:
The model doesn't “talk to the UI” directly. It just returns text that contains little islands tagged with artifact types that the frontend understands. It scans for these fences, validates the content against the schema for that type, and hands it off to the right renderer. To the user, it looks like the chatbot reply contains a live chart or graph they can play with.
Semantic code fences in practice
You’ve seen normal code fences:
We keep the same idea, but the “language” is semantic, instead of programming:
   ```chart
   data + chart spec
   ```

   ```knowledge_graph
   entity relationships data
   ```

   ```kpi
   data for kpi, including styles
   ```
The basic loop
Here’s the end‑to‑end flow:
-
User asks for something beyond prose
“What is a typical medical journey for patients who recieve an insertable cardiac monitor?”
“Show me the prescriptions for Drug A over the last 3 years.” -
The agent picks an artifact type
Instead of describing a chart, it emits:```chart { "type": "bar", "data": { "labels": ["2022", "2023", "2024"], "datasets": [ { "label": "Totals", "data": [245000, 198000, 312000] } ] } } ```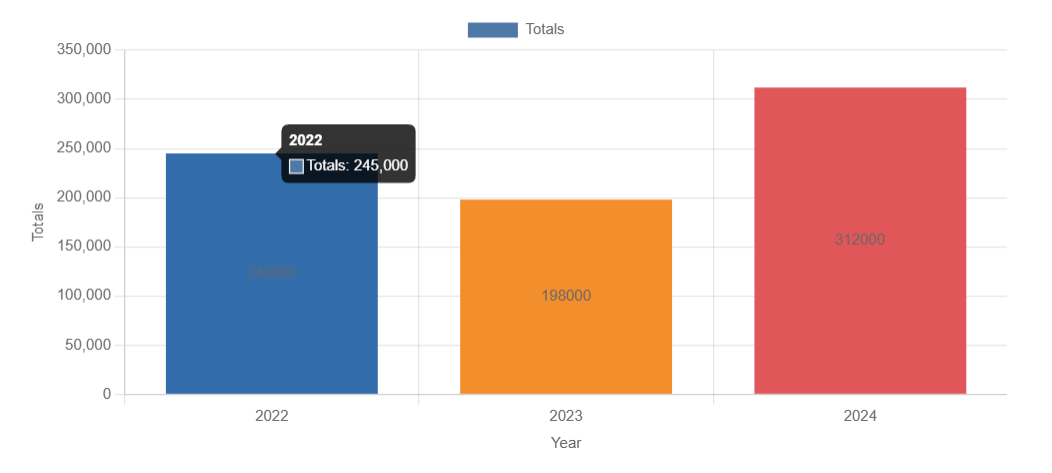
-
The client scans for fences On the front-end, we parse the message, find the fences, and look up the type in the artifact registry:
-
We validate and render If it passes the validation, we hand it to the renderer. If it fails, we fall back to an error + raw response.
-
The user sees a widget, not a blob To the end user, it’s just a chatbot reply with a live chart or graph embedded.
The chat protocol stays simple (still plain text), but the UI stays in control of what gets rendered.
graph TD
    %% Styling
    classDef user fill:#f9f,stroke:#333,stroke-width:2px;
    classDef system fill:#e1f5fe,stroke:#0277bd,stroke-width:2px;
    classDef logic fill:#fff9c4,stroke:#fbc02d,stroke-width:2px;
    classDef success fill:#e8f5e9,stroke:#2e7d32,stroke-width:2px;
    classDef fail fill:#ffebee,stroke:#c62828,stroke-width:2px;

    %% Nodes
    User((User)):::user
    Agent[Agent / LLM]:::system

    subgraph "The Agent Output"
        RawMsg[Message Content<br/>Prose + JSON in Fences]:::system
    end

    subgraph "Client-Side Parsing"
        Parser[Scanner parses message<br/>& identifies Fences]:::logic
        Registry{Lookup Type<br/>in Registry?}:::logic
        Validator{Validate<br/>Schema?}:::logic
    end

    subgraph "Render Logic"
        Renderer[Pass to<br/>Specific Renderer]:::success
        Fallback[Fallback to<br/>Error + Raw Response]:::fail
    end

    FinalUI[Final Interface Display]:::user

    %% Connections
    User -->|Asks for Chart/Data| Agent
    Agent -->|Generates Artifact| RawMsg

    RawMsg -->|Emits JSON| Parser
    Parser --> Registry

    Registry -- Type Found --> Validator
    Registry -- Not Found --> Fallback

    Validator -- Valid --> Renderer
    Validator -- Invalid --> Fallback

    Renderer -->|Widget Rendered| FinalUI
    Fallback -->|Blob/Text Rendered| FinalUI

    %% Note for context
    note1[Example: 'Show me Drug A prescriptions']
    note1 -.-> User
Backed by MCP
One piece that makes this scale: each element isn’t just a component—it also has its own MCP tool on the backend. This tool defines the input schema, explains when the agent should call it, and returns a semantic code fence that the agent can inject into the output. So the agent doesn’t actually write the fences itself. It decides when a user's query warrants an element-generating tool call, and gets back a ready‑to‑render fence.
You might be wondering why this cannot just be a giant system prompt. In theory, we could cram everything into one huge system prompt, like describing how to build and render the fences for charts, graphs or other artifacts. However, this doesn't scale well. The more artifacts you introduce, the longer your system prompt gets. This has three main drawbacks:
- LLM recall: the LLM (especially a smaller, less powerful one) forgets how to render certain artifacts, or struggles with consistency
- Cost: a longer system prompt means more tokens, which means higher api costs
- Latency: a longer system prompt means you wait longer for a response
In addition to solving these problems, the MCP + artifacts approach also buys us:
-
No infinitely growing prompt Each element carries its own “how and when to use me” inside the tool definition. Add a new element → add a new tool. The core prompt stays small.
-
Clear boundaries A chart tool focuses on chart JSON. A knowledge graph tool focuses on entity-relation-entity triplets. The agent just picks which tool fits.
-
Shared behavior across agents Any agent that knows about the artifacts gets the same capabilities. No copy‑pasting formatting rules across prompts.
-
Easy iteration Want to change the
chartschema? Update the tool + renderer. Prompts don’t have to be rewritten.
In practice, this means the chat window stops being a dead-end text box and becomes a live surface for work:
- A data analyst can ask, “Compare these companies' sales over time,” and immediately get an explorable chart they can sort, refine, and download—not just a paragraph about trends.
- A clinician can say, “Show me how drug A affects patients with comorbidity B,” and see an interactive knowledge graph instead of skimming through bullet lists.
- A product manager can track KPIs as live widgets right inside the conversation, instead of copy‑pasting numbers into a deck.
Because each artifact is backed by an MCP tool, they are consistent, reusable, and easy to extend. You don’t rebuild capabilities per‑agent or per‑prompt; you add a new artifact type once, wire it in, and every compatible agent can start turning chat into a real workspace—not just a nicer search box.
We are thinking of calling this approach "SAIL: Structured Artifact Interface Library". What do you think?